25
20
10
5
0
1890-1919 1920-1929 1930-1939 1940-1949 1950-1959 1960-1969 1970-1979 1980-1989 1990-2002
|
CHAPTER
THREE – |
3.1 Introduction and Definitions;
3.1 Introduction and definitions
Many people, including some with professional training in law and psychology, believe that child sexual abuse is a repetitive crime. This conception persists despite the results of many studies that show low rates of recidivism among sex offenders. Statisticians at the Bureau of Justice Statistics studied recidivism among sex offenders using a sample of two-thirds of those released from prison in the United States in 1994. The percentage of those re-arrested within three years for any crime was 43% for the sex offenders and 68% for all offenders. If only re-arrest for a sex crime is considered, 5.3% of all were rearrested within three years and 3.3% of those who were convicted of a crime against a child were re-arrested for another similar offense.14 Recidivism statistics in other studies of sex offenders fall between 5% and 15% for studies that follow their subjects for less than ten years and rises to 20% to 30% if the follow-up period is lengthened.15 These percentages are significantly lower than the average recidivism rate of 70% or more for robbery, burglary, larceny, and weapons possession.16
The low level of recidivism for another sex crime was also apparent in the Nature and Scope study, where more than half of all priests known to their dioceses for having been the subject of an allegation of sexual abuse were reported to have had a single victim. There is substantial debate among those who study sexual victimization about the likelihood that a person arrested for a crime of sexual abuse of children will repeat his or her crime. Those who argue for lower levels of recidivism point to the consistency of rearrest and re-conviction percentages as cited above that range from 5% to 15%. Other experts counter this position by arguing that the actual likelihood of repeated abusive behavior is understated as a result of the acknowledged under-reporting of sex crimes and the limits of official records.17 It is important to note that most of what is known about sex offenders with respect to recidivism is derived from the study of forensic samples, or those individuals who have come into conflict with the law and who have been identified as a consequence of their criminal justice system contact.
Within this substantial body of research is no indication that a majority of those who have been convicted of a sex offense are likely to commit another sex offense. The highest recidivism rates apply to those individuals with a substantial criminal history.
The form completed by diocesan staff for all priests in service was called the “Cleric Survey.” This instrument asked:
. • How many victims made allegations of sexual abuse against this cleric in your diocese?
. • Is there any indication that the cleric has abused more victims than there are official allegations made?
The second question was designed to elicit data about the diocesan knowledge of victims of sexual abuse who had not been willing to formally report their experience to the diocese. This question was intended to accommodate a situation in which a victim making a report included information about other individuals who had been victimized as children by the same priest, but who were not willing to make formal reports. While 55.7% of priests with allegations of abuse had one formal allegation reported to the diocese, the following analysis is based upon those who had a single formal accusation and no indication of any unreported events of abuse (no reported potential victims). The reason for not including those with a single formal allegation and other potential victims is so that the group of “single offenders” is as accurately drawn as possible, and to separate out those for whom there was evidence of unreported incidents of abuse.
This procedure yields a total of 1,880 cases, or priests with a single formal allegation of sexual abuse. This group of priests, now reduced by more than 500, represents 42.8% of all priests reported in the Nature and Scope study. We sought to understand the ways these individual priests were different from those who had a more extensive history of sexual abuse of children.
3.2 Comparative characteristics of single-victim and multiple-victim cases
Age and Ordination
The pattern of reporting for the group with single incidents was not substantially different from the overall pattern of reporting. Tables 3.1 and 3.2 provide a comparison of the clerics with a single victim and the clerics with 2-20 victims in terms of the decade of their birth and decade of their ordination. More than two thirds of the clerics in both groups were born between 1920 and 1949 (they are currently between 55 and 85 years old). However, for the single-incident cases, the distribution is somewhat more even: there are a greater number of cases at both ends of the distribution. Very young and very old clerics are more frequently found among single incident cases than in the group with of 2 to 20 incidents. For instance, clerics born between 1860 and 1919 represent about 19% of the single incident cases but only 13% of the multiple incident cases. A more important divergence is observed for very young clerics, with 13% in the single-incident group of those born after 1950 compared to 6% in the multiple-incident group.
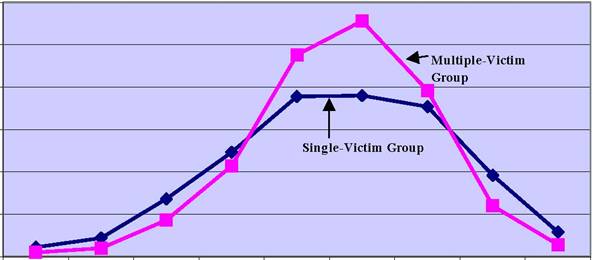
Figure 3.1 presents a visual representation of the ordination distribution patterns by group. The pattern observed in Figure 3.2 for decade of birth is consistent with that seen for decade of ordination: at both extremes of the distribution the clerics with a single incident are greater than the multiple case clerics. A question that remains is why the birth and ordination data are more often missing for single-incident group. A possible explanation would be that the files of those priests who had been reported by more than one person would have more detailed information. It is also possible that supervisors gave more careful attention to the cases of those priests who presented more serious problems. Further research as planned in the Causes and Context study is necessary to better understand the single-victim cases.
Table 3.1 Decade of Birth, Two Cleric Groups
| Decade |
Single |
Victim |
2 – 20 |
Victims |
|
|
Count |
% |
Count |
% |
|
1860-1899 |
45 |
2.4 |
25 |
1.3 |
|
1900-1909 |
98 |
5.2 |
59 |
3.2 |
|
1910-1919 |
208 |
11.1 |
166 |
8.9 |
|
1920-1929 |
324 |
17.2 |
394 |
21.0 |
|
1930-1939 |
373 |
19.8 |
526 |
28.1 |
|
1940-1949 |
406 |
21.6 |
476 |
25.4 |
|
1950-1959 |
184 |
9.8 |
110 |
5.9 |
|
1960-1969 |
47 |
2.5 |
25 |
1.3 |
|
1970-1979 |
3 |
.2 |
2 |
.1 |
|
Missing |
192 |
10.2 |
90 |
4.8 |
|
Total |
1880 |
100 |
1873 |
100 |
Table 3.2 Ordination Decade, Two Cleric Groups
| Decade | Single | Victim |
2 – 20 |
Victims |
|
|
Count |
% |
Count |
% |
|
1890-1919 |
21 |
1.1 |
9 |
.5 |
|
1920-1929 |
41 |
2.2 |
18 |
1.0 |
|
1930-1939 |
127 |
6.8 |
81 |
4.3 |
|
1940-1949 |
231 |
12.3 |
201 |
10.7 |
|
1950-1959 |
356 |
18.9 |
446 |
23.8 |
|
1960-1969 |
357 |
19.0 |
521 |
27.8 |
|
1970-1979 |
333 |
17.7 |
368 |
19.6 |
|
1980-1989 |
180 |
9.6 |
112 |
6.0 |
|
1990-2002 |
55 |
2.9 |
26 |
1.4 |
|
Missing |
179 |
9.5 |
91 |
4.9 |
|
Total |
1880 |
100 |
1873 |
100 |
Ordination Dates by Decade for Two Groups of Clerics
|
30 25 20 10 5 0 |
|
|
1890-1919 1920-1929 1930-1939 1940-1949 1950-1959 1960-1969 1970-1979 1980-1989 1990-2002 |
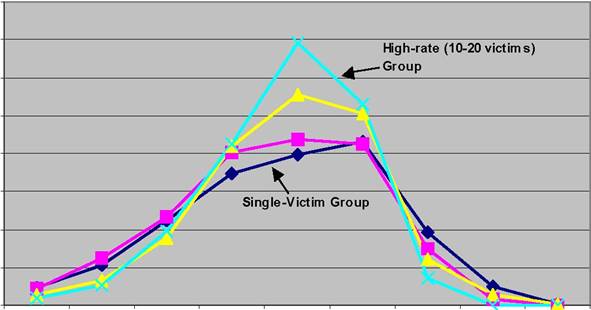
Figure 3.2 shows the decade of birth for four groups: the single-incident group, or those with no other potential victims; the single+ group, or those with one formal report but other potential victims; the multiple-victim group with 2-9 victims; and the multiple-victim group with 10-20 victims. For the single-incident cases, there is a smoother distribution of cases (i.e. greater number of cases at both tails of the distribution and less variation over the time period). In other words, those priests in the single and single+ groups do not show the dramatic pattern of those with 10-20 incidents – peaking in 1935 and yielding a group of priests who were in their mid-30s during the 1970s.
Figure 3.2
Distribution of Birth Decades for Four Groups of Clerics
|
30 25 20 10 5 0 |
|
|
1860-1899 1900-1909 1910-1919 1920-1929 1930-1939 1940-1949 1950-1959 1960-1969 1970-1979 |
|
|
|
Tables 3.3 and 3.4 count the total number of victims by age and gender.18 The group of single-victim priests had 1,178 male victims (66.7%) and 591 female victims (33.3%) compared to the group with multiple victims who were reported to have abused 6,089 male victims (84%) and 1,159 female victims (16%). Those priests with a single victim and no other potential victims were significantly more likely to have a female victim. Tables 3.3 and 3.4 also show that the single-victim group has more male and female victims in the 15-17 year-old age group. Specifically, the 15-17 year-old age group represents only 32% of the male victims for the multiple-victim group but 45% for those with only one victim. A similar difference can be observed for female victims, with the 15-17 year old age group representing 23.5% of the multiple victim group and 34.1% of the single victim group.
|
|
Single-Victim Group |
2-20 Victim Group |
||
|
Male victim age |
Count |
% |
Count |
% |
|
1-7 |
33 |
2.8 |
203 |
3.3 |
|
8-10 |
131 |
11.1 |
992 |
16.6 |
|
11-14 |
482 |
40.9 |
2930 |
48.1 |
|
15-17 |
532 |
45.2 |
1964 |
32.3 |
|
N |
1178 |
100 |
6089 |
100 |
Table 3.4
Distribution of Female Victims by Age
|
|
Single-Victim Group |
2-20 Victim Group |
||
|
Female victim age |
Count |
% |
Count |
% |
|
1-7 |
77 |
13 |
169 |
14.6 |
|
8-10 |
93 |
15.7 |
262 |
22.6 |
|
11-14 |
220 |
37.2 |
456 |
39.3 |
|
15-17 |
201 |
34.1 |
272 |
23.5 |
|
N |
591 |
100 |
1159 |
100 |
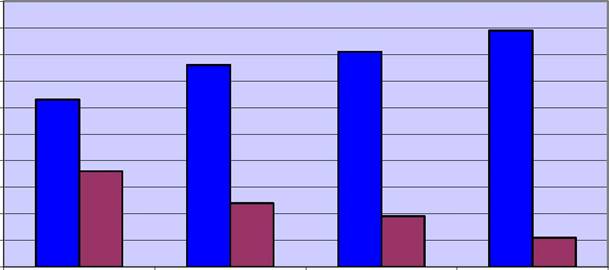
Figure 3.3 suggests that in terms of the victim selection, single-incident cases involved a higher percentage of female victims than any other group considered. Further, the higher the number of victims per cleric the lower the percentage of female victims. Figure 3.3 also suggests that there are important differences in victim selection between those who had a single allegation and no other potential incidents of abuse and the single + groups.
Figure 3.3
Percentage of Victims by Gender for Four Cleric Groups
|
100 90 80 70 60 50 40 30 20 10 0 |
|
| Single Single + 2 to 9 10 to 20 | |
|
|
Incidence and reporting over time
The distribution of the first dates of the incident that became the basis of an allegation of abuse against this group of priests resembles the overall distribution. Thus, these priests were subject to the same social and institutional pressures as those who continued to abuse – but did not do so. Victims of a single incident of abuse by a priest from this group are not more likely to have reported the incident within one year, and this pattern is consistent for peak years and throughout the time period.
3.3 Persistence of offending
When the persistence of sexual abuse behavior, or duration or abuse, is examined for the single-victim and multiple-victim groups, there are marked differences. A large minority of single-victim incidents of abuse (41%) lasted for less than one year. If the single-victim cases of one year’s duration are added to those lasting less than one year, the total is 56% of this group. In contrast, more than half (51%) of the multiple-victim group persisted in their abusive behavior for five years or longer. Table 3.5 displays these comparative percentages. Although, for a substantial number of cases, there is incomplete information, the difference in pattern is clear.
|
|
Single-Victim Group |
2 – 20 Victim Group |
||
|
Duration in years |
Count |
% |
Count |
% |
|
Less than 1 year |
782 |
41 |
382 |
17 |
|
1 year |
275 |
15 |
202 |
9 |
|
2 years |
168 |
9 |
212 |
10 |
|
3 years |
105 |
6 |
145 |
7 |
|
4 years |
74 |
4 |
127 |
6 |
|
5 years |
51 |
3 |
116 |
5 |
|
6 years or more |
25 |
1 |
1007 |
46 |
|
Missing |
330 |
18 |
309 |
14 |
|
TOTAL |
1880 |
100% |
2195 |
100% |
Single-incident clerics are less likely to have a recorded history of abuse (physical/sexual abuse and substance abuse) than clerics with more than one incident. The group of single-incident clerics included 4.2 % who had suffered physical or sexual abuse as children, compared to 8.8% of those with multiple incidents. In regard to substance abuse, 12.8% of those with one victim had histories of substance abuse compared to almost a quarter (23.5 %) of those with multiple allegations. Again, we cannot determine whether this contrast reflects a true difference in the experience and histories of these men or whether the files of the single-incident clerics were less likely to be detailed.
3.4 Coercion, treatment or self-correction?
There are a number of possible explanations as to why priests with a single allegation of abuse did not continue in this behavior. It is possible that the prompt reporting of incidents serves to deter future abuse, or it is possible that these men were successfully treated, or deterred from future offending by an interaction with someone in the Church or with the criminal justice system. It is also possible that they stopped, or chose to stop, for some other reason (e.g., guilt, shame, victim told him to stop, etc.). While the data do not give us information on this latter possibility, we were able to explore the pattern of reporting and the role of the criminal justice system and treatment, as well as their joint occurrence and influence.
Priests with multiple allegations of abuse were more likely to be in contact with the criminal justice system than those with a single allegation of abuse. The distribution of criminal justice interventions for both groups is nonetheless skewed towards the initial stages of a criminal complaint (victim contacted the police, police investigated and cleric criminally charged). Clerics with multiple incidents were convicted at twice the rate as single-incident clerics, as indicated in Table 3.6. These interventions, however, were only brought to bear on fewer than one in five of the priests with a single allegation of abuse.
Table 3.6
Criminal Justice System Interventions
|
|
Single-Victim Group |
2- 20 Victim Group |
||
|
CRJ Intervention |
Count |
% |
Count |
% |
|
Victim contacted police |
338 |
17.9 |
917 |
28.6 |
|
Police investigation |
318 |
16.8 |
737 |
25.4 |
|
Cleric criminally charged |
107 |
5.7 |
388 |
11.5 |
|
Cleric convicted |
62 |
3.3 |
296 |
7.8 |
|
Fine |
7 |
.4 |
17 |
.6 |
|
Probation |
36 |
1.9 |
83 |
3.3 |
|
House arrest |
1 |
.1 |
3 |
.1 |
|
Community service |
5 |
.3 |
13 |
.5 |
|
Jail |
8 |
.4 |
52 |
2.1 |
|
Prison |
18 |
1 |
82 |
3.3 |
|
Electronic Monitoring |
1 |
.1 |
2 |
.1 |
|
Other |
12 |
.6 |
16 |
.6 |
|
Sentence Pending |
2 |
.1 |
10 |
.4 |
|
Register pending |
0 |
0 |
2 |
.1 |
|
Life sentence |
0 |
0 |
3 |
.1 |
* Clerics may have interacted with the CRJ system in multiple instances.
Table 3.7 displays the percent of the priests in each group who were afforded various forms of treatment for their problems with sexual abuse behavior. Priests in the single-victim group were considerably less likely to be treated than those in the multiple victim group. When the co-occurrence of treatment and criminal justice contact is examined, no significant association is found. Overall, three in four clerics receiving treatment were not reported to the police by their victims. Few single-victim clerics get treatment, and of those who were treated, only about one in four had been reported to the police.
|
|
Single-Victim Group |
2- 20 Victim Group |
||
|
Treatment (TX) Modalities |
Count |
% |
Count |
% |
|
Specialized TX for clergy |
148 |
7.8 |
516 |
20.6 |
|
Specialized SO TX for all |
58 |
3.1 |
154 |
6.2 |
|
General TX program |
78 |
4.1 |
205 |
8.2 |
|
One-on-one psychological counseling |
181 |
9.6 |
498 |
19.9 |
|
Psychotherapist |
98 |
5.2 |
314 |
12.5 |
|
Relapse prevention |
35 |
1.9 |
135 |
5.4 |
|
Evaluation but no TX |
95 |
5 |
198 |
7.9 |
|
Spiritual counseling |
63 |
3.3 |
161 |
6.4 |
|
Other |
36 |
1.9 |
64 |
2.6 |
If there is no evidence of the efficacy of coercion (as a result of criminal justice system contact) or treatment to bring an end to the abuse behavior, it is plausible that these priests were able to understand the wrongness of the behavior and self-correct.
14 Bureau of Justice Statistics. (2003). Recidivism of Sex Offenders Released from Prison in 1994.
http://www.ojp.usdoj.gov/bjs/abstract/rsorp94.htm
15 Hanson, R.K. (2002). Who Is Dangerous and When Are They Safe? Risk Assessment with Sexual Offenders, in B.J.Winick, & J.Q. LaFond (Eds.). Protecting Society from Sexually Dangerous Offenders (pp.64-65). Washington DC: American Psychological Association.
16 Bureau of Justice Statistics. (2002). Recidivism of Prisoners Released in 1994. 06/02 NCJ 193427,
http://www.ojp.usdoj.gov/bjs/abstract/rpr94.htm
17 Hanson, R.K., Morton, K.E., & Harris, A.J.R. (2003). Sexual Offender Recidivism Risk: What We Know and What We Need to Know. Annals of the New York Academy of Sciences 989:154-166.
Follow-up studies on released sex offenders typically find sexual recidivism rates of 10%-15% after five years, 20% after 10 years, and 30%-40% after 20 years. The observed rates underestimate the actual rates because not all offences are detected; however, the available research does not support the popular notion that sexual offenders inevitably re-offend. Some sexual offenders are more dangerous than others. Much is known about the static, historical factors associated with increased recidivism risk (e.g., prior offences, age, and relationship to victims). Less is known about the offender characteristics that need to change in order to reduce that risk.
18 Although the data include information about victims for whom the age and gender are not both known, those victims are not included in Tables 3.3 and 3.4.
This Webpage was created for a workshop held at Saint Andrew's Abbey, Valyermo, California in 2005