 |
 |
 |
 |
 |
 |
 |
 |
 |
 |
 |
 |
 |
 |
 |
|
CHAPTER
ONE – |
1.1 Prevalence and regional patterns; 1.2 Patterns of reporting sexual abuse; 1.3 Reports of sexual abuse to the Church over time; 1.4 Estimation of unreported abuse
IN the 2004 report on the data gathered from all Catholic dioceses and religious institutes in the United States, the John Jay College researchers provided fundamental statistics about the extent of the sexual abuse of children by Catholic priests and deacons. The dioceses, eparchies, and religious institutes reported information on 4,392 individuals who had been the subject of at least one allegation of sexual abuse while serving in ecclesial ministry between 1950 and 2002. We found that this count of priests with allegations was 4.2% of all diocesan priests in ministry for that time period and 2.7% of all religious priests in ministry in the same period.
Although the request for information on allegations included both priests and deacons, there were only a small number (61) of deacons who had been accused. Of these men who were permanent deacons, 95% were ordained between 1970 and 1990. The events that gave rise to the allegations took place in a similar pattern to that of the overall incidence of abuse events. The statistics describing the deacons reported in the study and their victims did not show these men to be different from the ordained priests for whom data was reported. For the balance of this report, we will refer in the text to priests alone, and ask that it be understood that the 61 deacons are being counted as well.
Also in the first study, we found that the overall percentage of 4% of priests in ministry with allegations of sexual abuse was not only a general prevalence statistic, but that it was a fairly stable percentage across all fourteen regions of the Catholic Church and for large and small dioceses and religious institutes. The percentage of diocesan priests accused of sexual abuse ranges between 3% and 6% when the information is arranged by region and also when the information is arranged or sorted by the size of the diocese. Similarly, the percentage of religious priests with allegations ranged from 1% to 3% across all sizes of religious communities, when those with 10 or fewer members are excluded. From the consistency in the prevalence of allegations of sexual abuse in dioceses, the John Jay College researchers concluded that the problem was a general problem, not one that could be linked to dioceses in a particular area of the country, or to those with density of population or number of parishes.
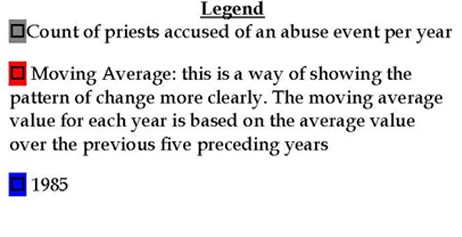
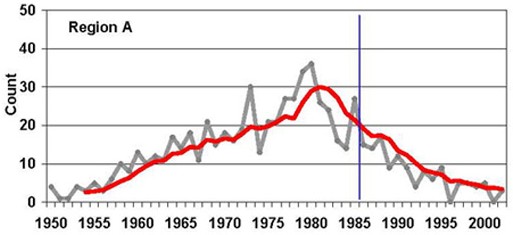
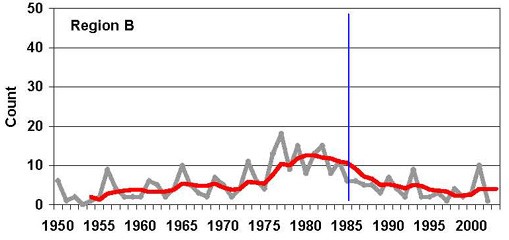
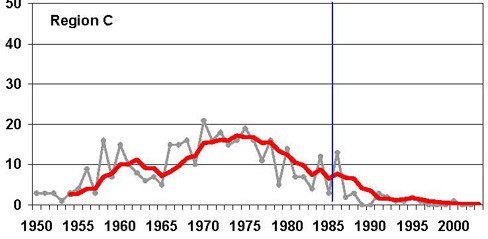
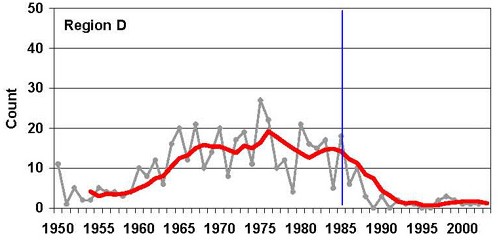
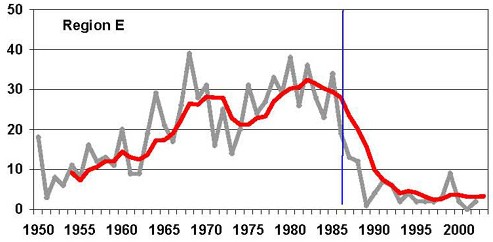
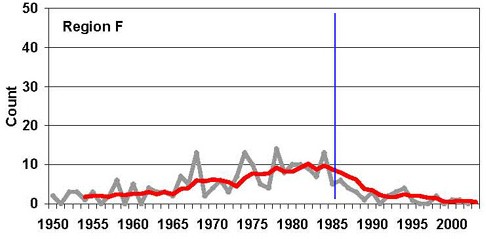
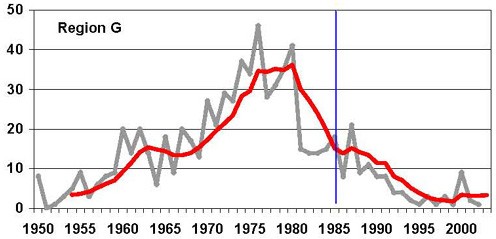
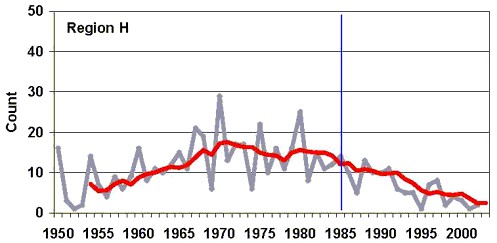
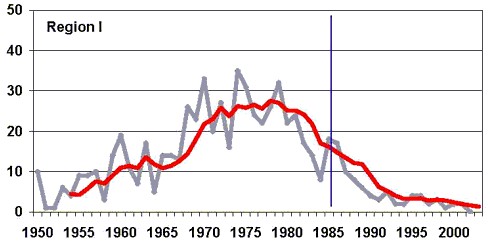
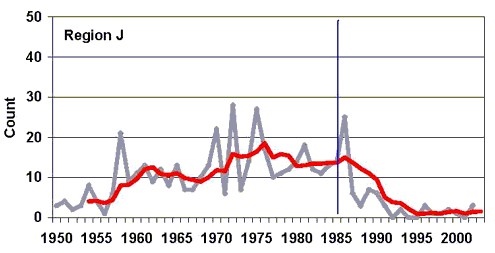
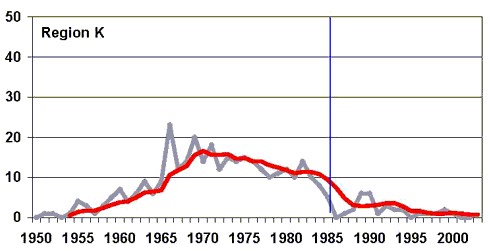
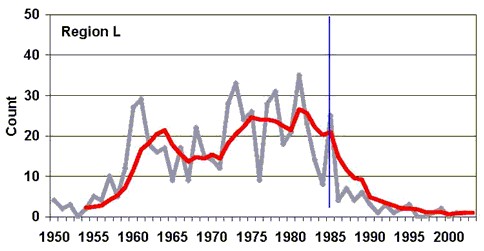
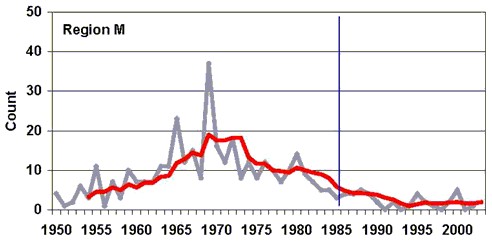
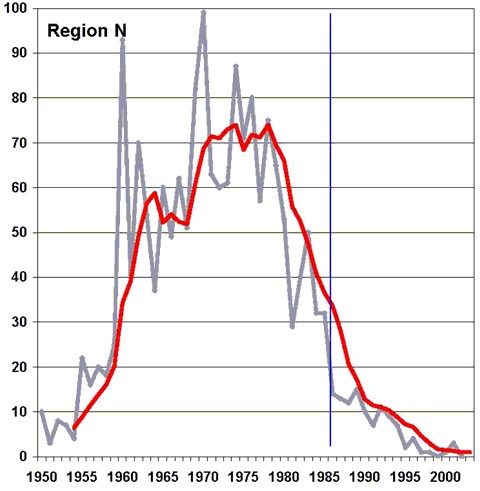
When the events of sexual abuse were displayed as yearly counts by date of occurrence over the 52 years from 1950 to 2002, we observed a gradual but steady increase until the early 1980s and then a more marked, but equally steady decrease. The pattern shown in the incidence of sexual abuse in the United States is now seen to be a consistent pattern in all regions of the Catholic Church. In the pages that follow, the information from each of the fourteen regions is displayed in a separate chart. To preserve anonymity the fourteen geographic regions of the Catholic Church in the United States have been randomly designated in Figure 1.1 with letters A through N.
Figure 1.1 Regional Distribution
of Sex Abuse Cases
(yearly counts by date of
occurrence per 14 regions)
|
|
|
|
|
|
|
|
|
|
|
|
|
|
|
|
|
|
|
|
|
|
|
|
|
|
|
|
|
|
The numerical scale for the number of events, shown on the left of the charts, (the vertical or y axis) is consistent for all charts except the final one in the series, Region N. The scale begins at 0 and rises to a maximum of 50. Thus, the shapes of the distributions seen in the charts are comparable. The events of abuse depicted in the charts in Figure 1.1 show total numbers of events known the Catholic Church by the end of 2002.
The year of 1985 is shown on each chart to indicate the date of case of Rev. Gilbert Gauthe, the attendant national publicity given his prosecution and imprisonment, and the circulation of the “Mouton-Doyle Report.”1
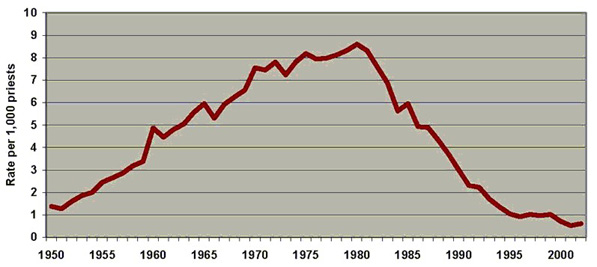
Although the number of men entering the priesthood declined over the period examined in the study, the total number of priests in ministry did not change as significantly. If the numbers of priests accused in a single year are shown as a rate, or index, per 1,000 priests in service, the shape is the same as that depicted in the preceding charts.
Figure 1.2: Accusation Rate of Catholic Priests over Time, 1950 – 2002
Range: from 58 in 1951 to 504 in 1980 to 52 in 1995 and 28 in 2002.
Priests in service: 42,970 in 1950, 58,908 in 1975, 45,713 in 2002.
 |
The delay in disclosure of sexual abuse by those who have been victimized is well-documented. The dramatic increase in the reports of sexual abuse in the 1990s and especially between 2000 and 2002, suggested the possibility that many more cases were yet to be reported. Table 1.1 below shows the number and percentage of reports of sexual abuse of children by priests received by the Catholic dioceses, by decade, from the 1950s to the period 2000 – 2002. For this report, we compiled a detailed analysis of reporting patterns: first, of those cases reported within a year of the date of the incident as compared to all cases and those with reporting delays of 25 or more years; second, patterns of disclosure that have been found in other studies of child sexual abuse were tested with the data from the Nature and Scope study; and finally, projections were made about unreported cases.
Table
1.1
Reports of Incidents of Sexual Abuse of Minors by Priests
|
Decade |
Number of Incidents |
Percentage of Total Reports |
|
1950 - 1959 |
53 |
0.5% |
|
1960 - 1969 |
190 |
1.9% |
|
1970 - 1979 |
266 |
2.6% |
|
1980 - 1989 |
1,146 |
11.2% |
|
1990 - 1999 |
4,022 |
39.4% |
|
2000 - 2002 |
4,533 |
44.4% |
|
|
N = 10,210 |
100% |
Differences in victim and reporting characteristics by time from event to report
The first date of an incident of abuse and the date of the report to the diocese were used to create groups of those who reported abuse in one year and those who waited more than 25 years to make a report, and to compare these groups to the averages for all incidents. In 9,510 cases, or 89.2% of the Victim Surveys received, full data was available to analyze reporting patterns. Data show that 1,176 incidents, or slightly more than one in ten, were reported quickly.
In contrast, 41% of the incidents were reported after more than 25 years. The contrast in delay in reporting does not seem to be associated with specific characteristics of the victim, the priest or the behavior that was alleged.
The results of this statistical comparison are summarized as follows:
Gender
The overall percentage of boys among all victims, (81%), was only slightly different from the early reporters, (78%), and those who waited 25 years or more, (77%).
Age at Time of Report
Of the female victims of abuse who reported within one year of the abuse date, the majority were under 14, with 12.4% being less 10 years of age. A different pattern is show by male victims who reported within a year, with almost 40% reporting at ages 15 – 17, and only 5% of those under 10 reporting quickly.
Type of Behavior Alleged
The distribution of behaviors that were described in the reports of sexual abuse are not markedly different when these groups are compared. Incidents reported in one year are
Use of Alcohol or Drug
Those who reported their abuse quickly were slightly less likely to have used alcohol or drugs with the priests than those who delayed their reporting.
Parish Context for the Abuse
There are no differences in the percentages of the parish role of the priests who were the subjects of the allegation (most were pastor or associate pastor), or of the circumstances of the meeting between priests and victims (at mass and in other parish activities), nor of the likelihood of the family of the victim being persistent (50% of families made an effort to follow-up on their reports). Families who reported abuse quickly were somewhat less likely to have socialized with the priest who was accused.
Number of events in an incident of abuse
In 58% of the incidents of abuse reported within one year, the abuse happened only once. If all allegations are considered, the percentage of one-time events falls to 29%. Of those who waited at least 25 years to report abuse, 26% reported an incident that happened once.
Form of Report to Diocese
Parents were more likely to report the abuse of a child when the allegation was made within a year of the event of abuse. Although telephone calls and letters accounted for the majority of reports, 19% of those who reported within one year spoke to a parish priest directly about the abuse.
Research on Disclosure of Sexual Abuse by Children
The factors drawn from the academic studies that are associated with disclosure of child sexual abuse in general fall into the following three categories: victim characteristics, abuser characteristics, and characteristics of the context of abuse. Within these areas, there are additional patterns of reporting that come from the current study data that are not explored in the extant literature. These are as follows: the impact of same-sex abuse on reporting, and the impact of social conditions that draw forth reporting (decade of reporting differences).
Gender and Disclosure
The majority of the research on disclosure of sexual abuse included either exclusively female victim populations, or the overwhelming number of those who disclosed in a study were female (between 75 – 80%). Only one study has specifically targeted male victims of child sexual abuse.2 The study by M.A. Reinhart was based on responses from 189 boys, and contrasted to the responses of girl victims. The researchers found no significant differences in the patterns of disclosure between genders (regardless of the wide array of acts committed against the boys). Older boys experienced sodomy more often, although this did not seem to impact reporting.
Age and Disclosure
Young children are more likely to disclose abuse accidentally and older teenagers, more purposefully.3, 4 But the majority of studies found delays of 10 to 20 years in reports of sexual abuse that had been experienced in childhood.5, 6
Victim Complicity, Familiarity, and Disclosure
If a child victim of sexual abuse feels responsible or complicit in the abusive relationship, the delay in reporting is increased.7 Delays in reporting are positively associated with longer duration of abuse and also with the emotional closeness of the relationship.8
Duration and Severity of Abuse and Disclosure
The frequency of the contacts between victim and abuser,9 the duration of the abuse,10 and the severity of the acts alleged11 have all been found to prolong the delay in the reporting of child sexual abuse.
Duration of childhood sexual victimization has been found to have a positive relationship with delays in reporting. This association, that the longer an abusive relationship continues, the likelihood of a delay in reporting increases, is true, according to these data, when all cases are included as well as in selected years and time periods. Overall, the strongest positive and significant correlation between duration and delays in reporting is observed in the period before publicity began (1950 – 1980). The correlations are weaker for later non-peak publicity periods, and 2002, the greatest publicity peak year, has the lowest correlation between the variables in this analysis. Similar results are found for the severity of sexual acts: if an incident includes penetration, the average time to reporting is increased by two years. Each of the above-referenced research results can be replicated using the Nature and Scope data, but the differences found are relatively small. The large number of cases in the Nature and Scope study means that small differences are often statistically significant. These differences detected can therefore be expected to be accurate for the phenomenon, and affirm the prior research findings, but do not, in themselves, explain the overall shape of the reporting of sexual abuse by Catholic priests.
|
|
|
1.3 Reports of sexual abuse to the Church over time |
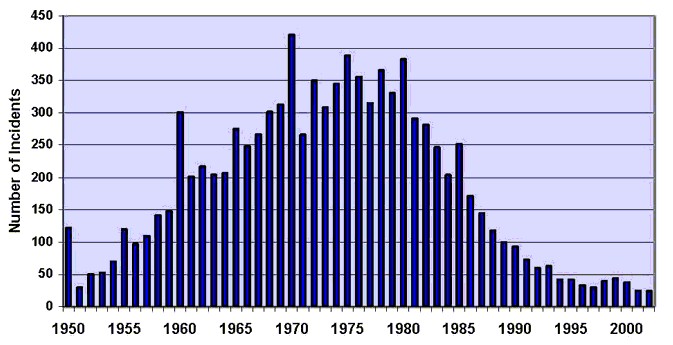
The 2004 report on the Nature and Scope study included a chart of the total number of reports each year of the study period – illustrating the remarkable fact that approximately a third of all reports were made in 2002 after an average delay of 30 years. Nothing in the available research could have predicted this surge in reports. The yearly patterns in delay of reports were used to model expected reports in future years. Prior to 1985, 810 cases of child sexual abuse by Catholic priests had been reported to the dioceses and religious institutes of men. Figures 1.3 and 1.4 show the dramatic difference in what was known in 1985 and what was known in 2002 about a crisis of sexual abuse. The scale on both charts is the same.
Figure 1.3: Incidents of Sexual Abuse Known or Reported to the Church by 1985
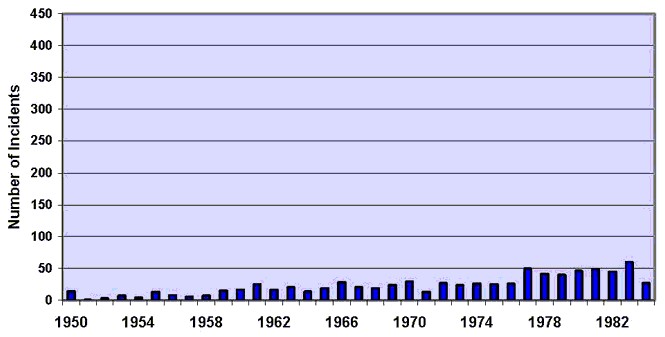 |
Figure 1.4: Incidents of Sexual Abuse Known or Reported to the Church by 2002
 |
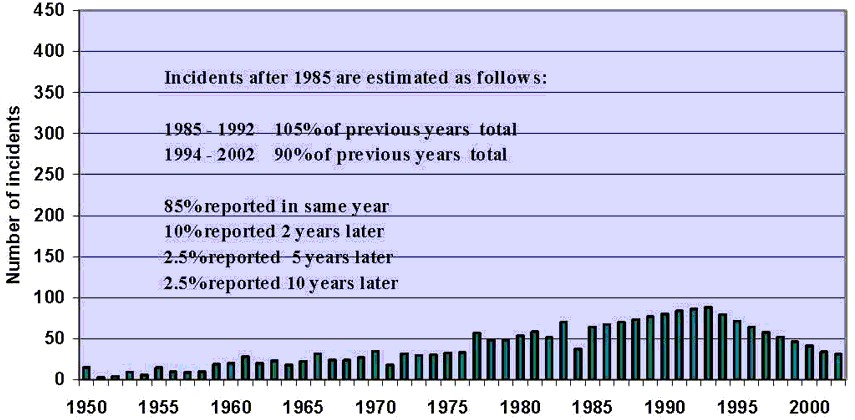
The distribution of the 810 cases of child sexual abuse known before 1985 is shown in Figure 1.3. The reporting of these allegations had the following pattern: 85% of the cases were reported in the first year, 10% reported 2 years later, 2.5% reported 5 yrs later, and 2.5% reported 10 years later. Using this pattern of reporting, a calculation of the distribution of the abuse cases, 1950 through 2002, would generate the chart shown in Figure 1.5
Figure 1.5: Total Incidents, if Estimated Based on 1985 Reporting Pattern
 |
However, reporting patterns changed significantly after 1985. By 2002, only 10% of cases were reported in the first year, with a much larger proportion reported more than 25 years after the abuse occurred. If the allegations reported in 1993 are used to estimate what the distribution of sexual abuse allegations would look like by 2002, the result is compared in Figure 1.6 to what would come to be known by 2002.
Figure 1.6: Total Incidents Known and Estimated Through 2002, Using 1993 Reporting Pattern
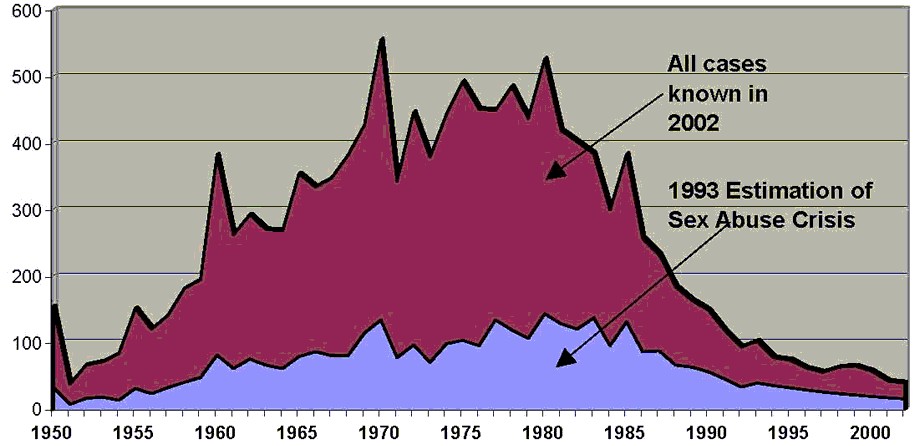 |
Although only one-third of cases were known by 1993, the shape of the distribution is similar to what is now known. This stable shape is as a result of the slowing of the Sexual abuse is underreported, and more people will come forward to report allegations of abuse. However, reporting patterns have stabilized over the last decade, and reports every year now fit the distribution you see here. This means that the decrease in sexual abuse cases is a true representation of the overall phenomenon. Even if more cases are reported, they will be based primarily on abuse that occurred years before, and the shape of the abuse crisis will remain as it is shown in Figures 1.1 and 1.4.
Figure 1.7 shows all cases reported prior to 2002, and Figure 1.8 shows all cases reported in 2002. The distribution of cases in 2002 is almost identical to the distribution of cases prior to that, and the approximately 1,000 allegations reported in 2004 show the same distribution as those reported in 2002. This stability in the cases reported by year supports a conclusion that the overall shape of the problem, or pattern of cases over time, is stable. It is the shape of the crisis of sexual abuse over the period 1950 – 2002. Although more cases will be reported, they will fit this pattern.
Figure 1.7: Incidents Reported Before 2002
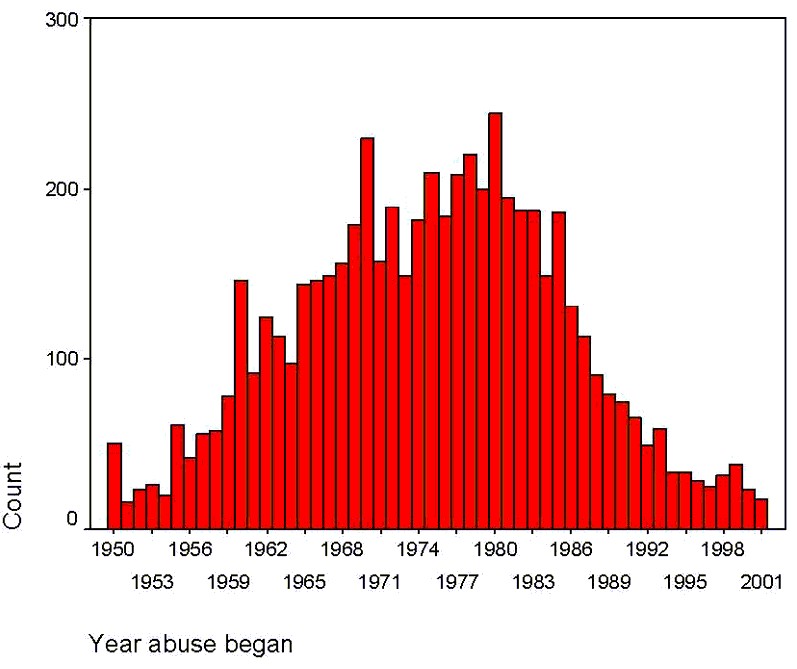 |
Figures 1.7 and 1.8 both include a bar for each year of the study period, and each bar shows the number of incidents of sexual abuse that were reported to begin in a particular year. The two charts have different scales: Figure 1.7 can display up to 300 incidents per year, and Figure 1.8 can display up to 200 incidents per year.
Figure 1.8
Incidents Reported in 2002
|
|
|
1.4 Estimation of unreported abuse |
In order to confirm that the shape of the abuse crisis is stable, a mathematical estimation procedure was carried out on the reporting data to estimate what is not known – the total number of actual events of abuse by Catholic priests during the study period. A natural approach, used here, is to analyze abuse reports to estimate the probability distribution of abuse occurrences over the years. In such an approach, the distribution's parameters are chosen so as to best model the abuse report dates, and the properties of the specific distribution so constructed are then amenable to being interpreted as inherent characteristics of the data that it models.
The difficulty in this approach is that there is every reason to believe that the distribution itself evolves over time. Clearly, the probability distribution in 1990 was different from the distribution in 1970, since the two distributions disagree on the probability of some event. To the extent that our analysis of the data is a dialogue with the probability distribution in 2005, the evolution of the distribution over time is crucial to conclusions that are intended to be historical explanations or predictive forecasts
Since in this part of the study we are concerned with estimating the distributions of abuse occurrences, and quantifying how this distribution evolved over time, we chose to restrict the victim data set to just two variables: abuse date and report date. Victims who reported abuse dates spanning a range of years were counted as having one abuse incident for each year within the stated range. For each year y (in the range 1950-2002) we extracted a truncated subset Dy consisting of only those incidents with a report date prior to y. In essence, Dy is the empirical evidence available by year y, on the basis of which the distribution would have been estimated (had this study been conducted in year y). Given two years a and b (with a ? b), we denote the number of incidents which occurred between a and b (inclusive) that were reported prior y as Dy(a; b).
For each year y in the range 1950-2002, we modeled the distribution of abuse dates for all incidents in Dy using a normal distribution. The Gaussian parameters (mean ¹y and standard deviation ¾y) were estimated by applying the Expectation Maximization algorithm12 to the set of abuse dates for incidents in Dy. This algorithm determines the Gaussian distribution most likely to produce the data. Figure 1.22 below shows the relationship of ¹y to y. As is apparent from Figure 1.22, the mean of the normal distribution at 1950 is 1950, since that is the date at which the formal data-gathering began for this study. Between 1950 and 1980, the mean of the normal distribution increased steadily, indicating that reports of recent abuse incidents consistently outweighed the cumulative mass of older incidents (since reports of new occurrences are able to “pull” the mean of the distribution forward). Between 1980 and 1990, the mean of the distribution advanced at a constant rate, always lagging behind the current date by approximately 15 years. In 1990, a dramatic shift occurred, and between 1990 and the present, the mean of the distribution stabilized and then decreased, indicating that reports of new occurrences were no longer commensurate with the cumulative mass of older abuse occurrences. The distribution of abuse dates for all incidents in Dy was considered to determine the year in which the number of incidents dropped most significantly.13 For all years y before 1987 analysis of the data prior to 1987 would have shown no significant drop to have ever occurred, and consequently the curve corresponding to ) = 5 begins to fall at 1987. Analogous statements hold for the curves when ) = 7 (which starts at 1989) and ) = 10 (which starts at 1992).
Figure 1.9
Estimation of Population of Cases, Including Unreported Cases
In summary, the several forms of modeling and estimation of the unreported cases of child sexual abuse by Catholic priests produced consistent results. The dramatic number of cases reported in the year 2002 could not have been predicted simply on the basis of the prior years’ data and calculation of lags to time of disclosure. The decline in cases in the 1990s that can be seen on all of the preceding charts is confirmed to be not simply a decline in reporting of cases, but in the incidence of unreported events.
1 Doyle, T.P. & Rubino, S.C. (2004). Catholic Clergy Sexual Abuse Meets the Civil Law. Fordham Urban Law Journal, 31 549-617.
2 Reinhart, M. A. (1987). Sexually abused boys. Child Abuse & Neglect 11: 229-235.
3 Campis, L. B., Hebden-Curtis, J., & Demaso, D.R. (1993). Developmental differences in detection and disclosure of sexual abuse. Journal of American Academy of Child and Adolescent Psychiatry, 32(5): 920-924. This study examined the role of developmental differences in the detection and disclosure of child sexual abuse. The researchers used random medical record review of 72 children/adolescents seen over a three-year period for suspected child sexual abuse. Preschool age kids were significantly more likely than older children/adolescents to show symptoms related to behavior or physical problems that made an adult caretaker suspicious of the possibility of sexual abuse. Younger children make accidental reports that are often preceded by some immediate precipitating event, but not that of child sexual abuse. The inverse was found for older children. Disclosure was measured as verbal statements made to a caregiver.
4 Paine, M. L. & Hansen, D. J. (2002). Factors: Influencing children to self-disclose sexual abuse. Clinical Psychology Review, 22: 271-295. This study provides a comprehensive review of the literature related to disclosure of childhood sexual abuse. Variables mentioned to correlate with disclosure and non-disclosure are: context of abuse, context and elements of children's disclosures, inhibitions towards disclosure, models of disclosure. Delayed reporting into adulthood, related to difficulty in revealing the secret, was further supported by studies noting the crises that occur after disclosure. Children with long-term abuse will have greater risk for more long-term negative effects. Often, a lack of physical evidence of sexual abuse places the onus of reporting on the child victim. There are emotional and behavioral indicators of childhood sexual abuse, but none are conclusively or diagnostically fail-proof. Reporting has increased after the imposition of mandatory reporting statutes, but even suspected cases still go unreported by healthcare and social work professionals. Research findings reveal that many children have had to disclose multiple times over a period of time in order to be believed by the person to whom the child is disclosing (in many cases a parent). The credibility of a child's accusation increases when abuse is verified with physical evidence or eyewitnesses.
5 Roesler, T. A. & Wind, T.W. (1994). Telling the secret: Adult women describe their disclosure of incest. Journal of Interpersonal Violence, 9 (3): 327 – 338. The sample in this study was derived from calls to a national child abuse treatment and research center after the media disclosure (on national television) of a female celebrity who endured years of incest. Callers were asked if they would like to be a part of a research project about child abuse. Of the surveys mailed (over 700), approximately 38% were returned. Over 75% were returned by female victims of incest. The results reflect the responses of the female respondents only, and only those who experienced childhood sexual abuse by someone who was a relative by blood or by marriage.
6 Lamb, S. & Edgar-Smith, S. (1994). Aspects of disclosure: Mediators of outcome of childhood sexual abuse. Journal of Interpersonal Violence, 9 (3): 307 – 326. This article primarily deals with the relationship of disclosure to recovery. The study was conducted using volunteers willing to complete a telephone survey pertaining to their history of sexual abuse, history of repeated disclosures and current socio-emotional functioning. The mean age of this sample is 30 years old, about 10 years younger than in the Roesler & Wind (1994) incest study. The respondents are again overwhelmingly female (79%). Abuse mean age is eight years old (range two to 16). The mean age of the first disclosure is 18 years old. About one-third of this sample did disclose under the age of 14 yrs. The duration of abuse was shorter for the male respondents than the female respondents, and about one-third of the females were abused for more than five years. About one-half of the female victims reported regular frequency of abuse (weekly). Of those who disclosed abuse before the age of 15, one-half told a family member. Of the two-thirds who disclosed in adulthood, 67% told a friend or a member of the "helping professions."
7 Goodman-Brown, T. B., Edelstein, R.S., Goodman, G. S., Jones, D. P. H, & Gordon, D.S. (2003) Why children tell: A model of children's disclosure of sexual abuse. Child Abuse & Neglect, 27: 525-540. Researchers investigated variables associated with delays in disclosing child sexual abuse. The study used 218 cases referred to a district attorney's office. The five variables they explored are: child age, gender, type of abuse (intra or extra familial), perceived responsibility, and fear of negative consequences of disclosure. Children's cognitive appraisals of the tolerance of others toward the disclosure of child sexual abuse, and 8 Smith, D. W., Letourneau, E. J., Saunders, B.E., Kilpatrick, D.G., Resnick, H. S., & Best, C.L. (2000). Delay in disclosure of childhood rape: Results from a national survey. Child Abuse & Neglect, 24(2): 273-287. This study sought to collect and describe delays in reporting by female victims of childhood rape. Data was collected from 3,220 respondents (wave II) of a National Women's Study (1993). Nine percent (288) of wave II respondents indicated having experienced one event before the age of 18 that met the study's definition of child rape. This was a telephone survey about women's experiences with trauma and mental health. Nearly one-third (28%) reported never having told anyone about child sexual abuse Nearly one-half (47%) waited five or more years to report. Most often these women told close friends when they did disclose. Delays of more than one month were related to younger age at the start of abuse, the closeness of the relationship between the victim and the perpetrator, and multiple experiences of rape. Ninety percent of the women in the sample knew their perpetrators. Just over half (55%) indicated single event experiences of rape. Stranger rape is associated with shorter delays in reporting. The long delay group was younger than the short delay group at the time of abuse (by 2.3yrs when comparing mean ages at abuse). Use of force was slightly more common in the long delay group. See also, Paine, et. al.
9 Lamb, et. al.
10 Arata, C.M. (1998). To tell or not to tell; Current functioning of child sexual abuse survivors who disclosed their victimization. Child Maltreatment, 3(1): 63-71. This study's purpose was to uncover the impact of child sexual abuse on female victims, as well as to understand what factors influence disclosure. Disclosure seemed not to be related to functioning as an adult. Disclosure tended to be less common with more severe levels of assault and when the perpetrator was related to the victim. Results show that disclosure may be helpful in impeding the development of post-traumatic symptoms. This is particularly true with increased severity of physical abuse. Also, if the abuse lasts over one year, the likelihood of reporting decreases. See also Lamb, Roesler.
11 Arata, Paine, Smith
12 Dempster, A.M., Laird, N.M. & Rubin, D.B. (1977) Maximum likelihood from incomplete data via the EM algorithm. J. of the Royal Statistical Society, Series B, 34:1—38.
13 Formally, we deemed this to be the year xy in which the quantity Dy(xy ¡ ¢; xy) ¡ Dy(xy; xy
This Webpage was created for a workshop held at Saint Andrew's Abbey, Valyermo, California in 2005
Resolution 100 width 5.97